
Bricks
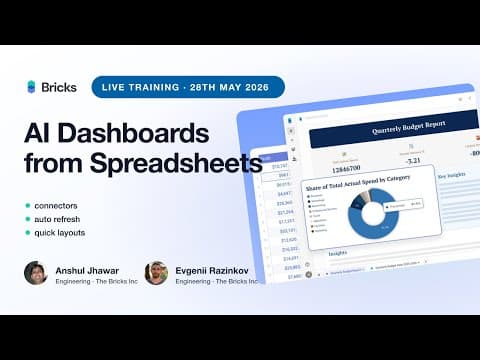
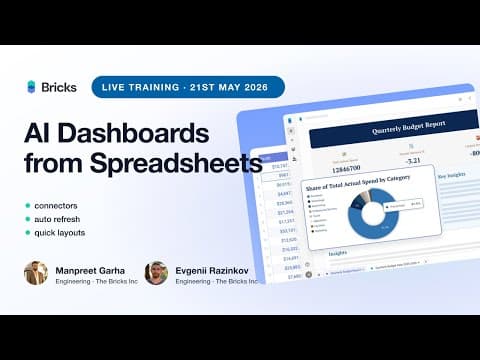
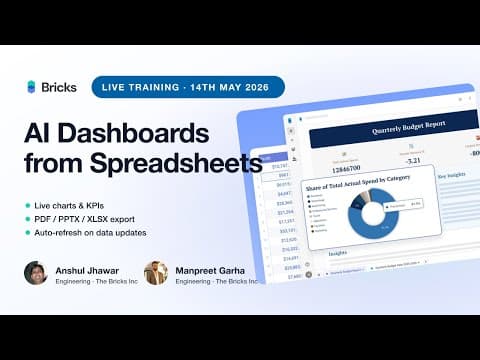
Bricks is an AI data analyst that turns CSV, Excel, and PDF files into polished dashboards and reports in seconds. Upload a file or connect Google Sheets, Postgres, MySQL, Stripe, HubSpot, or GA4, and the AI picks chart types, writes the analysis, and lays out the visuals. Beyond auto-generated dashboards, it ships a spreadsheet grid with formulas and pivot tables, a drag-and-drop visual board, AI charts, org charts, and export to PDF, PPTX, XLSX, HTML, Tableau and Power BI. Natural-language prompts handle chart edits, formatting, data cleaning, and one-click refreshes that preserve your layout. Built for people who need analyst-grade output without the analyst — ops, finance, marketing, HR, and small teams that find Tableau and Power BI overkill and Excel dashboards too manual.
Everything worth knowing about Bricks
The complete picture — from everyday features to the technical detail builders and IT folks dig for.
What it actually does
Who uses it
Real use cases, no hype- Instant dashboards from CSV/Excel/PDF uploads
- Canva-level polish without design skills
- No SQL, formulas, or coding required
- Data encrypted, never used to train models
- Narrative storytelling beats Tableau/Power BI
- AI message metering hard-caps usage per plan
- One-click refresh preserves layout while re-pulling data
- Tableau/Power BI/PPTX/XLSX/HTML export support
- AI messages burn fast on heavy edits
- Free tier limited to 20 AI messages/mo
- Weak fit for big data or complex DB models
- API support still 'coming soon'
- Most advanced features locked behind $100/seat Pro
- Dataset scale capped at a few thousand rows
- No native big-data warehouse pipelines
- Connector coverage thinner than mature BI stacks
The deep-dive specs
FAQ
Includes technical Q&ATraffic Insights
Monthly Visits
—
November 2026
Growth Rate
0%
vs last month
Dominance
0%
in Analytics
Top Country
—
Top Countries Breakdown
—
Growth Trend
Stable
Traffic has remained stable.
No sneaky tiers, no “contact sales”
Here's who each plan is actually for — and where the hidden charges might hit.
Official pricing, checkout, and plan upgrades are handled directly on thebricks.com.
What the internet actually thinks
Data refreshed weekly. No paid placements.
Leave a Comment
Help others make informed decisions. Your honest feedback shapes the community's understanding of this tool.
Tips for commenting
- •Be specific about features you used
- •Share real use cases and results
- •Mention both pros and cons
- •Keep it honest and constructive
Your comment is published immediately.
No comments yet
Be the first to share your experience with this tool.
Not quite the right fit?
Here's what else is out there.