Cube

Cube

Cube is an agentic analytics platform that provides a foundational semantic layer for modern data stacks. It centralizes data modeling, access control, and caching, serving as a governed interface for both human users and AI agents. Its core capabilities include natural language analytics via Analytics Chat, proactive agentic workflows, multi-agent architectures, and embedded analytics for customer-facing applications. The platform is designed for data teams and software companies. It enables data engineers to build semantic models in code, data analysts to explore data without writing ad-hoc SQL, and business users to query data conversationally. For AI integration, Cube provides a semantic SQL interface and APIs that allow agents like Claude or ChatGPT to deliver reliable, context-aware insights grounded in a consistent data model.

Analytics
Visit website
Added on
Jul 13, 2026
Semantic LayerNatural LanguageAgentic AIEmbedded BISQL APIMulti-agent
Product information

Everything worth knowing about Cube

The complete picture — from everyday features to the technical detail builders and IT folks dig for.

Core features

What it actually does

Natural Language Analytics
Allows business users to ask questions in plain English; AI generates answers grounded in a governed semantic layer for reliable, consistent metrics.
Code-First Data Modeling
Define metrics, joins, and access policies as code (YAML/JS) in git. Enables version control, CI/CD, and AI-assisted model edits with human review.
Agentic Workflows
AI agents proactively surface insights, identify trends/anomalies, and automate analysis without manual prompts, powered by multi-agent architectures.
Embedded Analytics
Ship dashboards, workbooks, and AI chat interfaces inside your own product, with full multi-tenant access control and consistent semantic models.
Technical capabilities
Semantic SQL Interface
Postgres-compatible SQL with `MEASURE` function extensions. AI agents query the semantic layer, not the raw warehouse, ensuring governed, consistent data access.
Pre-aggregation Caching
Declarative rollup tables (pre-aggregations) stored in Cube Store. Queries auto-route to cached results for fast performance and predictable warehouse costs.
Must watch videos
Results freshness indicator in cube
4:06
Tutorial4:06
Results freshness indicator in cube
Here I show how the freshness indicator works in workbook, dashboard builder and published dashboard modes. It allows you to understand at a glance how fresh is the data you see on a chart.
Extracting data: CSV export + copying values in Cube
1:41
Tutorial1:41
Extracting data: CSV export + copying values in Cube
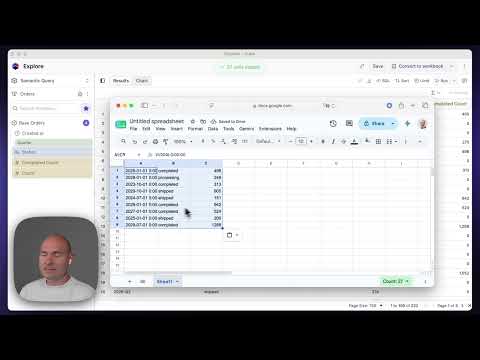
Select a block of cells in a Cube table and copy it straight into a spreadsheet, with or without column headers. Works in the Results, in workbooks, and on dashboards. Read more in the docs: https://docs.cube.dev/docs/explore-analyze/charts/chart-types/table#selecting-and-copying-cells
Fill in Missing Rows in Cube
3:43
Tutorial3:43
Fill in Missing Rows in Cube
Fill in Missing Rows in Cube — never lose empty days on your charts again Time-based charts have one annoying problem: when a query only returns rows where something happened, missing dates silently disappear from the axis. In this video I show a feature that fixes it in a single click — Fill in Missing Rows. What you'll see: • Turn it on in the result table and get a row for every missing day, week, month, quarter, or year — your real data stays untouched • Per-series zero points when you break down by a dimension • How it works: the date range comes from your filters (or the min/max dates in the data), and the query and generated SQL don't change — rows are added at render time • Everything is computed in the browser with a 10,000-row cap; exceed it and an indicator appears in the column header — just narrow the date range or drop a dimension The setting is saved with the report and applies everywhere it shows up, including dashboards and published dashboards. 🔗 Learn more about Cube: https://cube.dev 📚 Docs: https://docs.cube.dev/docs/explore-analyze/workbooks/querying-data#filling-in-missing-rows #Cube #SemanticLayer #Analytics #TimeSeries #DataVisualization #BusinessIntelligence #FillInMissingDates #DateGaps

Who uses it

Real use cases, no hype
Internal Business Intelligence
Enable data teams and business users to explore data with governed metrics and dashboards.
Embedded Analytics
Ship analytics surfaces and APIs inside your product for customer-facing insights.
Natural Language Analytics
Business users ask questions in plain language and get answers grounded in the data model.
Agentic Workflows
AI agents autonomously surface trends, anomalies, and recommendations.
Data Modeling
Define metrics, dimensions, and joins in code with version control.
Access Control
Centralize security policies at the semantic layer for all consumers.
Performance Optimization
Use pre-aggregations and caching for sub-second query responses.
What's great
  • Code-first data modeling with version control
  • Semantic layer ensures consistent metrics
  • Natural language analytics for business users
  • Multi-API support (SQL, REST, GraphQL)
Technical strengths
  • Pre-aggregation caching for fast queries
  • Access control at semantic layer
  • Agentic workflows and AI integration
Where it falls short
  • Requires upfront data modeling effort
  • Steep learning curve for YAML/JS modeling
  • Limited built-in visualization options
  • Vendor lock-in for Cube Cloud features
Technical limitations
  • Dependency on Cube Store for caching
  • Semantic layer adds query overhead
  • Complex setup for multi-tenant access
For technical folks

The deep-dive specs

Core Architecture
Open-source semantic layer (Cube Core)
Data Modeling
Dataset-centric with Cubes & Views (YAML/JS)
Query Interface
Postgres-compatible Semantic SQL with MEASURE
Caching Engine
Cube Store for distributed pre-aggregations
Access Control
Code-based policies (Python/JS), row-level security

FAQ

Includes technical Q&A
Cube uses a semantic layer to centralize metric definitions, access control, and caching, ensuring consistent and governed analytics across all consumers.

Traffic Insights

Monthly Visits

September 2026

Growth Rate

0%

vs last month

Dominance

0%

in Analytics

Top Country

Top Countries Breakdown

Growth Trend

Stable

Traffic has remained stable.

Honest pricing

No sneaky tiers, no “contact sales”

Here's who each plan is actually for — and where the hidden charges might hit.

Free
Free

Individuals / Developers

  • Up to 10 GB data processed
  • Community support
  • Core semantic layer
  • Basic caching
Team
$450/mo

Teams

  • Up to 100 GB data processed
  • Standard support
  • Advanced caching
  • Team collaboration
  • AI agent access
Business
Most picked
$950/mo

Teams

  • Up to 500 GB data processed
  • Priority support
  • Advanced pre-aggregations
  • Custom data models
  • Enhanced security
  • Embedded analytics
Enterprise
Contact Sales/mo

Enterprise

  • Unlimited data
  • Dedicated support & SLAs
  • On-prem / VPC deployment
  • Custom integrations
  • Advanced governance
  • 24/7 phone support
Reviews

What the internet actually thinks

Data refreshed weekly. No paid placements.

Trustpilot
Not reviewed yet
G2
G2
Not reviewed yet
C
Capterra
Not reviewed yet
Product Hunt
Not reviewed yet
COMMUNITY COMMENTS

Leave a Comment

Help others make informed decisions. Your honest feedback shapes the community's understanding of this tool.

Tips for commenting

  • Be specific about features you used
  • Share real use cases and results
  • Mention both pros and cons
  • Keep it honest and constructive
Sign in to leave a comment

Your comment will be published after moderation

Filter by rating:
Sort by:

No comments yet

Be the first to share your experience with this tool.

Alternatives

Not quite the right fit?

Here's what else is out there.

Detail tags
Found via these searches
#SemanticLayer#DataModeling#Analytics#BI#EmbeddedAnalytics#AI#OpenSource